Real prompts, real data, real output — no cherry-picked demo scripts. Each example below is an unedited conversation with Claude using CDS as an MCP tool.
Energy Markets · United States
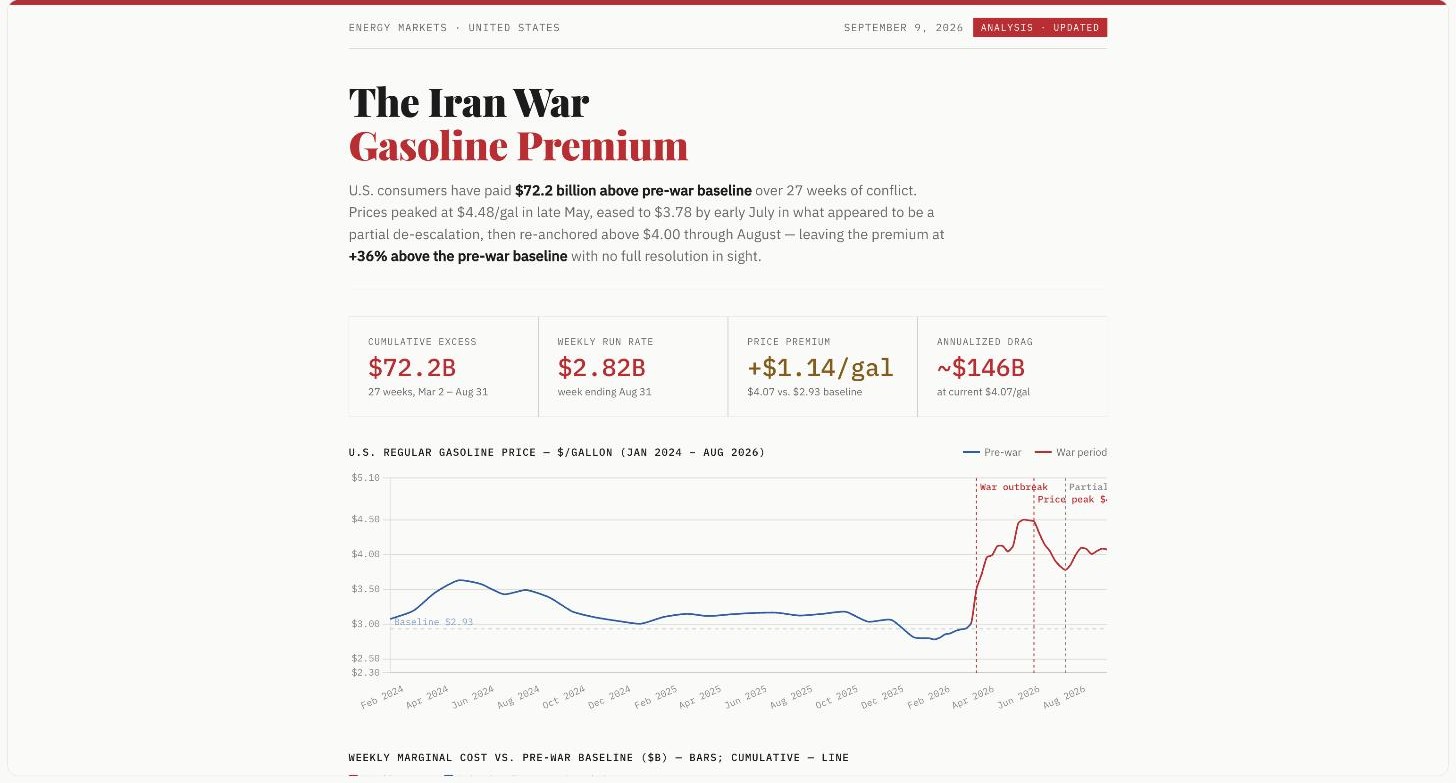
The Iran War Gasoline Premium
What did a 27-week conflict actually cost U.S. drivers? CDS pulled weekly EIA gasoline price history, and Claude computed the cumulative excess over a pre-war baseline: $72.2B, or $2.82B/week at the latest reading.
get_gasoline_pricesget_gasoline_expenditure
The actual prompts
“Use CDS to answer the question: what has been the marginal cost of the Iran war on gasoline expenditures”
“Rebuild as a shareable artifact”
“Can we update the artifact so that the x-axis has a uniform timescale — it jumps from months to weeks, so the slope of the y-axis is misrepresented”
Revenue $2,025M, +30% YoY — driven by all-flash growth plus a 53-week fiscal year adding an extra week of results
Acquired DataPelago, Inc. on July 16, 2026 for $193M ($87M paid in cash at closing)
Executed a restructuring plan: $56M in charges this quarter vs. $2M a year ago
All-flash mix rose to 72% of Hybrid Cloud segment revenue, up from 64% a year ago
$200M in buybacks + $102M in dividends this quarter; $1.3B still authorized for repurchases
MD&A text is 50.3% similar to the prior quarter's — about half the section was rewritten, not just updated numbers
SEC Filings · NTAP
What changed in NetApp's latest 10-Q
A one-line question, no follow-up artifact — just Claude reading NetApp's actual Q1 FY2027 10-Q (filed 2026-09-02) and diffing it against the prior quarter to find what's genuinely new versus routine restatement.
get_mdacompare_filingsget_company_info
The actual prompt
“Using CDS what are the key changes in NetApp's latest 10-Q filing?”